How To Identify Breakout Stocks In The Market
The stock market offers countless opportunities for investors, but one of the most sought-after phenomena is the breakout stock. These are stocks that break through a period of consolidation, surging in price and volume, often signalling the beginning of a new upward trend. Identifying breakout stocks before they make their big moves can be a game changer for any investor. In this article, we will cover various ways to identify breakout stocks and how to analyze them using technical analysis, volume indicators, and market sentiment.
What Are Breakout Stocks
A breakout occurs when a stock moves beyond a resistance level or key price point, signalling a shift in market sentiment. This shift is often driven by new information, such as positive earnings reports, product launches, or market trends. The price movement that follows a breakout is typically accompanied by increased trading volume, which is one of the most important indicators of a potential breakout.
Breakout stocks are particularly attractive because they present significant profit potential. However, identifying them early requires attention to detail and an understanding of market signals. A stock that is about to break out often displays certain characteristics that can help you spot it before the general market catches on.
Key Indicators For Identifying Breakout Stocks
Several indicators and strategies can help you spot breakout stocks. The most effective ones involve a mix of technical analysis, chart patterns, and market sentiment. Below are some of the key indicators to pay attention to when searching for potential breakout stocks.
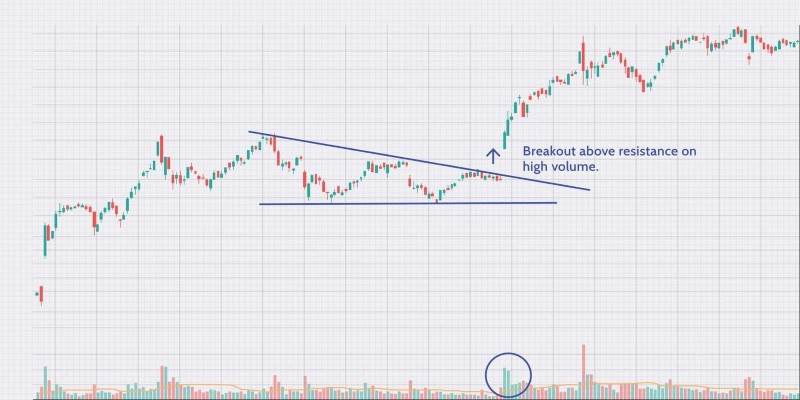
Price Patterns And Chart Breakouts
One of the most reliable ways to identify breakout stocks is by analyzing price patterns on stock charts. Certain patterns can indicate that a stock is poised for a breakout. Among the most common chart patterns are triangles, channels, and flags.
Triangles:
Triangular patterns occur when the price moves within a converging range. As the stock price narrows, the breakout is more likely to occur. Ascending triangles, in particular, are a strong signal that a stock might break out to the upside, as the stock consistently makes higher lows while the resistance remains in place.

Flags And Pennants:
These formations occur after a sharp price movement, followed by a consolidation phase. Flags are rectangular-shaped, while pennants are small symmetrical triangles. Both indicate that the stock may resume its previous trend after a period of consolidation.
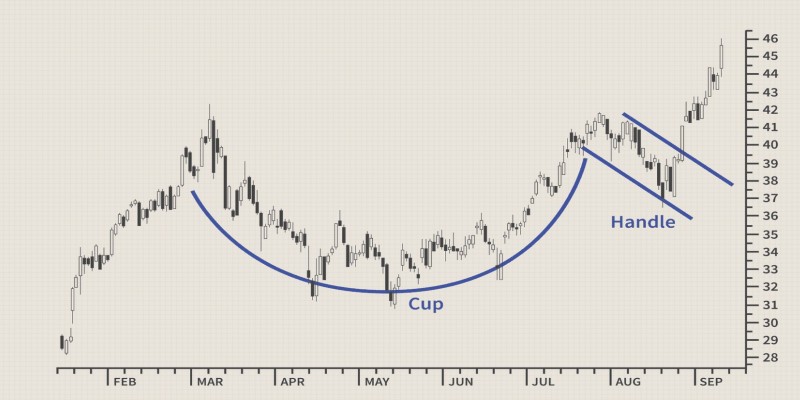
Cup And Handle:
This is a classic bullish pattern where a stock forms a rounded bottom (the cup) and then a smaller consolidation (the handle) before the breakout.
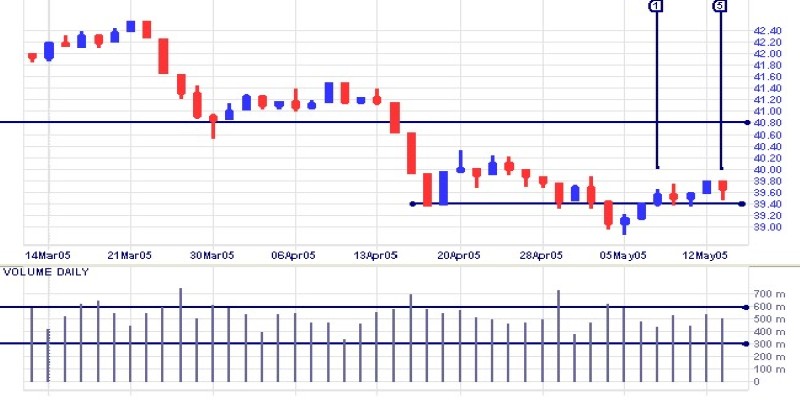
Volume Analysis
Volume is perhaps the most important factor when identifying breakout stocks. A breakout with increasing volume signals that the move is genuine and not a temporary fluctuation. The volume should rise above its average level when the price breaks through a key resistance level. This surge in volume shows that more market participants are entering the stock, supporting the upward trend.
Above-Average Volume:
A breakout accompanied by above-average volume is a clear signal that there is strong interest in the stock. It is important to confirm that the volume is at least 50% greater than the average daily volume before considering a breakout as valid.
Volume Spikes:
A sudden increase in volume can also indicate a potential breakout. This might happen if there is unexpected news, a product release, or earnings results that exceed expectations.
News And Market Sentiment
Understanding the broader market sentiment and news surrounding a stock is crucial for identifying breakouts. News events such as earnings reports, mergers and acquisitions, or regulatory approvals can drive significant price movements. Positive news, especially unexpected good news, can trigger a breakout.
Earnings Surprises:
A company that reports better-than-expected earnings can often experience a price surge as investors adjust their expectations. This is often the catalyst for a breakout.
Industry Trends And Market Sentiment:
A positive shift in the market or sector can also lead to a breakout in individual stocks. Keep an eye on broader market trends, such as shifts in interest rates, inflation, or industry-specific developments.
Risk And Reward Management
Identifying breakout stocks is only part of the equation; risk management is just as important. Stocks that break out can be volatile, and it is crucial to have a strategy to manage potential losses. When you identify a breakout stock, set a stop-loss order just below the breakout level to protect your capital in case the move fails.
Setting Stop-Loss Orders:
A stop-loss order will automatically sell your stock if it falls below a certain price, limiting potential losses. The stop-loss should be set at a level that aligns with the stock's volatility and breakout pattern.
Target Price:
Along with a stop-loss order, determine a target price where you plan to take profits. This will help you manage your trade and ensure you don’t hold onto a breakout stock for too long, potentially missing out on gains.
Historical Breakouts And Volume Patterns
Another way to identify potential breakout stocks is by studying historical breakouts and volume patterns. Some stocks are more prone to breakouts than others, particularly those with a history of volatile price movements. Look for stocks that have previously experienced strong upward trends after consolidating at key support or resistance levels.
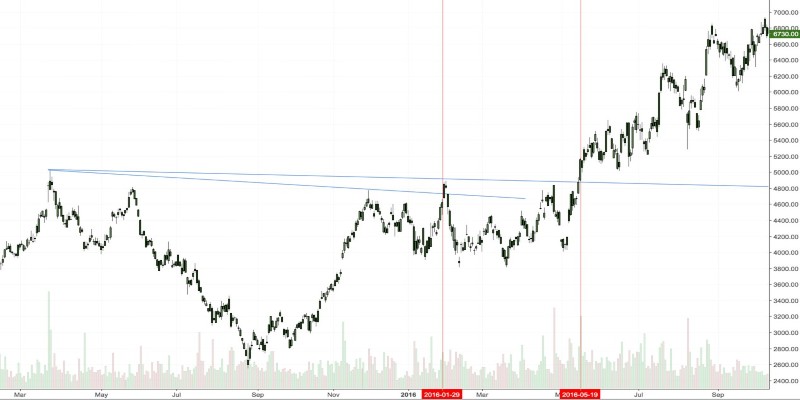
Past Breakouts:
If a stock has a history of breaking out from key resistance levels with increasing volume, it is more likely to repeat that behaviour in the future.
Volume Patterns:
Pay attention to stocks that frequently experience spikes in volume, even during periods of consolidation. This can indicate that there is latent interest in the stock, which could eventually lead to a breakout.
Conclusion
To successfully identify breakout stocks, you need to use a combination of technical analysis, volume analysis, and market sentiment. It's important to be patient and wait for confirmation that the breakout is real. False breakouts can happen, so it's essential to ensure that the stock’s price is moving with genuine strength and that the volume supports the move.
By analyzing price patterns, watching for volume surges, and using technical indicators such as moving averages and RSI, you can increase your chances of identifying breakout stocks. Additionally, keeping an eye on market news and sentiment can help you spot catalysts for potential breakouts.